

How to Read Item 19 Earnings Claims in Pet Franchise FDDs

Top TLDR: Item 19 earnings claims in pet franchise FDDs are the optional financial performance representations a franchisor may publish in the Franchise Disclosure Document. When present, Item 19 shows average or median unit revenue, sometimes gross profit, and occasionally net figures, drawn from a defined sample of operating units over a defined period. Read Item 19 alongside Item 20 franchisee conversations and your own market research, never as the only data point driving your investment decision.
If you have read a Franchise Disclosure Document for any pet franchise, you have probably flipped to Item 19 first. The earnings disclosure is the closest thing to a published track record a franchise opportunity offers. It is also one of the most misread sections of the entire document. Buyers tend to treat the headline average as a forecast for their own future location, when the actual numbers are doing something more limited and more specific than that.
This walkthrough covers what Item 19 earnings claims in pet franchise FDDs actually disclose, why some franchisors include them and others do not, how to read the disclosure critically before committing to a franchise investment, how to cross-reference the data with franchisee conversations from Item 20, and how to build a conservative financial model from Item 19 data without treating any single number as a guarantee.
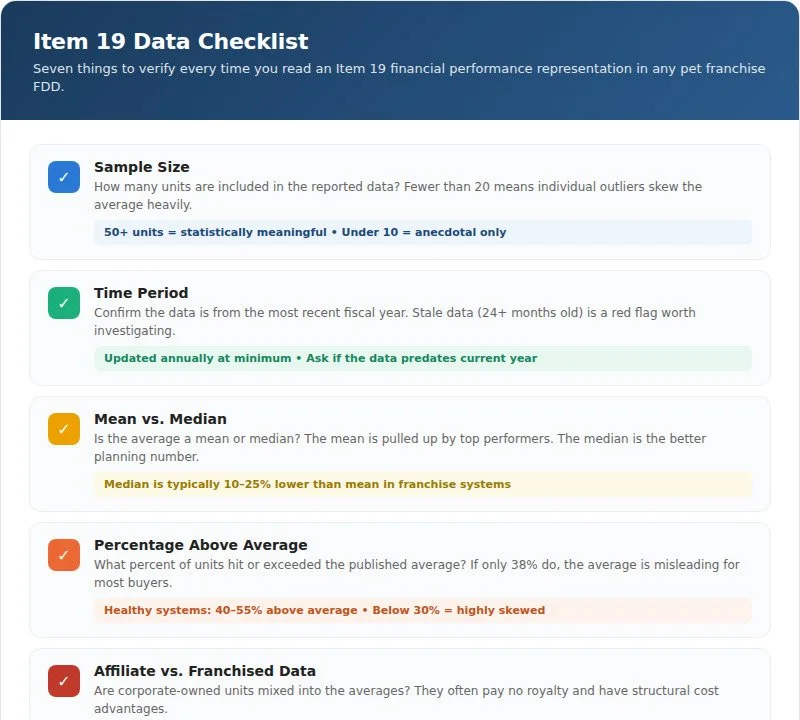
What Item 19 Actually Is
Item 19 is the section of the Franchise Disclosure Document where a franchisor may, but is not required to, present financial performance representations about its operating units. The FTC franchise rule allows franchisors to publish revenue, expense, profit, or other financial data, provided the data is presented honestly and with the disclosures the rule requires.
If a franchisor includes an Item 19, three things must be present. First, the franchisor must have a reasonable basis for the claim. Second, the franchisor must disclose the material assumptions and characteristics of the underlying data. Third, a written substantiation must be available to prospective buyers on request.
If a franchisor does not include an Item 19, no franchisor or representative may make any earnings claim verbally or in marketing materials. Discussion of revenue, profit, or unit performance becomes restricted to what the franchisor's existing franchisees say in their own conversations with you. The Federal Trade Commission enforces this restriction, and violations carry consequences including regulatory action and private lawsuits from franchisees who relied on undisclosed claims.
The plain-language walkthrough of the Franchise Disclosure Document explains where Item 19 sits in the larger document and how it relates to the other 22 items.

Why Item 19 Is Optional, and Why That Matters
The Federal Trade Commission's Franchise Rule does not require Item 19 to contain any earnings data. A franchisor can choose to publish detailed performance numbers, publish limited data, or publish nothing at all. Each choice carries consequences under the Rule, and each tells prospective buyers something about how the franchisor views its own system performance.
This means Item 19's presence or absence is itself a signal. A franchisor who chooses to publish detailed performance representations is giving candidates real numbers to work with, and is accepting the legal exposure that comes with putting those numbers on record. A franchisor who publishes nothing is choosing not to commit. That can mean several things, and the reasons are worth understanding before drawing any conclusions.
Reasons Pet Franchisors Omit Item 19
Roughly 60 to 70 percent of franchisors across all categories include an Item 19. The remainder choose not to, for several reasons that are not all equal.
Limited operating history. A franchisor with fewer than 10 to 15 operating units often does not have a large enough sample to publish meaningful averages. Disclosing performance from three units would set expectations the franchisor cannot reliably support, and the wide variance inherent in small samples makes any average misleading.
High variance between units. Some categories have wide variation in unit performance based on local market factors. A franchisor with a 5x range between top and bottom performers may decide the average misleads more than informs. Pet franchises with mixed revenue streams like memberships, day passes, beverages, and events tend to show more variation than single-service concepts.
Strategic positioning. Some franchisors prefer prospective buyers to evaluate the opportunity through Item 20 franchisee conversations rather than through published averages. This is not necessarily a red flag, but it does shift more research burden onto the buyer and changes how you have to build your financial model.
Litigation risk. Item 19 representations carry liability if the underlying data is later challenged. Franchisees who invest based on Item 19 averages and underperform those averages sometimes pursue legal claims alleging the data was misleading. Some franchisors decide the legal exposure is not worth the marketing benefit, especially in a competitive franchise-sales environment where Item 19 numbers can become the centerpiece of sales conversations.
Data that does not help recruitment. If existing unit performance is below industry benchmarks or has declined in recent periods, publishing Item 19 data may actively work against the franchisor's development goals. A franchisor in this position may choose to leave Item 19 blank while working to improve system performance to a level worth disclosing.
The absence of an Item 19 is information, not necessarily a problem. A franchisor that does not publish one should be able to explain the reason clearly and without deflection. The validation walkthrough for franchise opportunities covers how to evaluate an opportunity when Item 19 is not available.
For candidates evaluating Wagbar's dog franchise opportunity, the question to ask first is simple. Does the current FDD include Item 19 data? If yes, read it carefully using the framework in this guide. If no, ask why and plan to rely more heavily on Item 20 franchisee calls.
What Item 19 Can Legally Contain
The FTC Rule limits Item 19 to historical financial performance of existing units, not projections. Forward-looking claims are prohibited. Guaranteed earnings are prohibited. Anything that looks like a promise about future performance is prohibited. What remains is backward-looking data about units that have actually operated, presented with enough context for a prospective buyer to evaluate what the data means.
Categories Item 19 May Include
Gross revenue or sales ranges for existing franchised or affiliate-owned units
Average unit volumes, usually reported with the percentage of units above and below average
Cost-of-goods data if the franchisor chooses to disclose it
Labor and occupancy expense ranges
Net income figures, if disclosed
Same-store sales growth across multiple reporting periods
Revenue by category, which in multi-line businesses like dog park and bar operations might split membership, day-pass, beverage, and event revenue
Gross profit figures and in some cases EBITDA ranges
Breakdowns by location type, geography, or years of operation
Categories Item 19 Cannot Legally Include
Forecasts of what a new unit will earn
Guarantees or promises about performance
Projections adjusted for a specific market or territory
Cherry-picked data from outlier locations presented as representative
Any figures that lack a documented historical basis
For a category-specific view on how revenue mixes in dog park and bar operations, Wagbar's profit margin overview with real franchisee stories covers the multi-stream revenue pattern that would show up in an Item 19 disclosure.
Types of Financial Performance Representations
When an Item 19 is present, the data falls into several categories. Understanding what each type tells you, and what it does not tell you, is essential for reading the disclosure correctly.
Gross revenue or sales. The most common disclosure type. Shows total dollars coming in the door before any expenses. This is the easiest figure to substantiate, since it pulls directly from royalty reporting. It is also the least useful number for projecting profitability because it tells you nothing about what it costs to generate that revenue.
Adjusted gross sales. A definition specific to the franchisor's royalty calculation. Often excludes specific items like sales tax, certain refunds, and sometimes online or wholesale revenue. Read the definition carefully because adjusted gross sales is what Wagbar and most pet franchisors actually base royalty on, not gross revenue. The gap between gross revenue and adjusted gross sales can be meaningful, and understanding the franchisor's specific definition prevents you from overestimating the royalty base.
Cost of goods sold or specific expense categories. Less common in pet franchises but sometimes included for categories with significant inventory costs in retail and supplies. When present, this data starts to paint a picture of unit-level economics rather than just top-line revenue.
Gross profit. Revenue minus cost of goods. Useful for category benchmarking but masks operating expenses like labor, rent, insurance, and marketing. A unit with strong gross margins but high fixed costs can still leave the owner with very little.
Net profit or operating income. Rare. When present, it is usually labeled as "before owner compensation" or "before debt service," which materially changes how you read it. A net profit figure of $150,000 before owner compensation and debt service might leave the owner with $40,000 after paying themselves and servicing an SBA loan.
Membership counts, transaction volumes, or unit-level operational metrics. Some franchisors include these alongside revenue figures. Useful for understanding how the headline number is built and for benchmarking against comparable businesses in your market.
The pet franchise investment numbers walkthrough covers what the typical revenue and cost structure looks like for pet franchise categories.
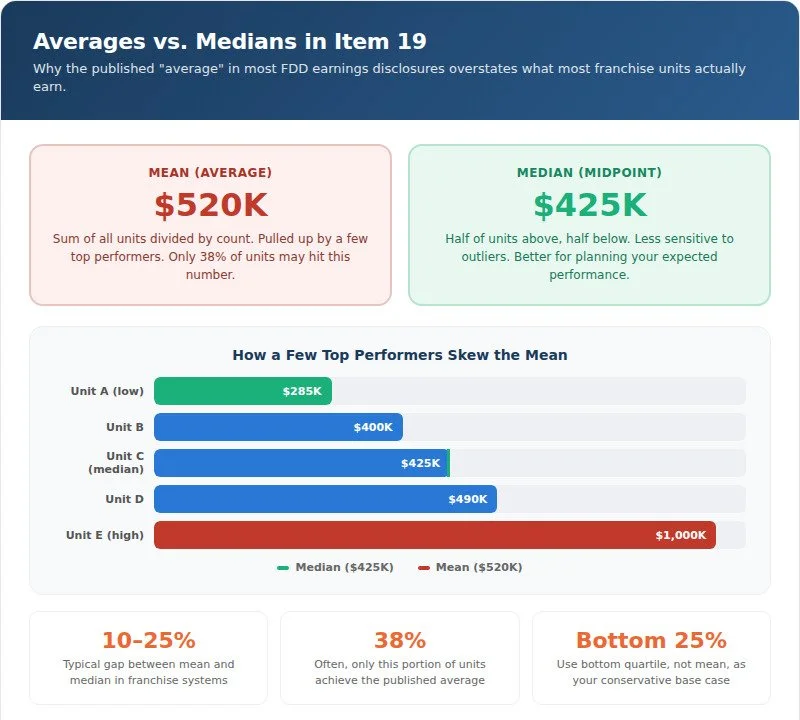
How to Read an Item 19 Average Critically
A typical Item 19 disclosure for a mid-sized franchisor might read something like this. "Among the 47 franchised locations open for at least 24 months as of December 31, 2024, the average gross revenue was $X. Of those 47 locations, 18 (38 percent) achieved or exceeded the average."
The Three Things to Extract
Sample composition. "47 locations open for at least 24 months." This excludes newer locations and any that closed. Newer locations typically run below the mature average, so excluding them shifts the headline upward. Closed units are also excluded, which omits the lower tail of the distribution. The number you see in Item 19 is almost always more optimistic than the full-system reality because the sample is curated by design.
Time period. "December 31, 2024." Trailing 12-month data is most common. Confirm the year is recent. Stale data, meaning anything more than 24 months old, is a flag. If the FDD you receive in 2026 still reports 2023 data, ask why the update has not been filed.
Percentage achieving the average. "18 of 47 (38 percent) achieved or exceeded the average." This is the single most important number in the disclosure. If only 38 percent of units hit the average, then 62 percent fell below it. The average is being pulled up by top performers, and a buyer projecting their own performance against the average is implicitly betting they will be in the top third. That is an optimistic assumption for a first-time operator entering a new market.
The Biggest Trap in Item 19 Averages
Averages in Item 19 can hide as much as they reveal. A $500,000 average unit volume across 20 units can mean wildly different things depending on the distribution. Five units at $1 million and 15 units at $333,000 produce the same average as 20 units clustered between $475,000 and $525,000. The first distribution is volatile and means most operators are significantly below the published average. The second is predictable and means the average is a reasonable proxy for most units. An average alone cannot tell you which pattern the system actually has.
What to look for beyond the average itself includes the percentage above average, the median versus mean comparison, quartile breakdowns when available, and year-over-year consistency across multiple reporting periods. If Item 19 reports multiple years of data, check whether the averages are stable, rising, or falling. Volatility matters for planning because it suggests the system has not yet found its equilibrium performance level.
The Item 7 initial investment walkthrough covers how to pair Item 19 averages with Item 7 investment ranges to model realistic ROI scenarios.
Median vs. Mean and Why the Distinction Matters
The "average" published in most Item 19 disclosures is the mean, which is the sum of all unit revenues divided by the unit count. The mean is sensitive to outliers. A handful of high-performing units can pull the mean significantly above what most units actually achieve.
The median is the middle value when units are sorted by performance. Half the units perform above the median and half perform below. For most franchise systems, the median is lower than the mean, often by 10 to 25 percent. This gap exists because franchise systems typically have a few standout performers that skew the mean upward while most units cluster at a lower level.
If a franchisor publishes only the mean, ask for the median. If the franchisor publishes both, the median is the better number for projecting your own expected performance because it represents the midpoint of actual operator outcomes rather than a figure distorted by outliers. If the franchisor declines to share the median, treat that as data about how confident the franchisor is in the underlying distribution. A franchisor with a healthy, tight distribution has nothing to hide by sharing the median.
Quartile breakdowns are even more useful when available. A disclosure that shows top quartile, median, and bottom quartile gives buyers a real picture of unit-level variation. The top quartile tells you what the best operators achieve. The bottom quartile tells you what happens when things do not go as planned. The gap between them tells you how much the outcome depends on factors beyond the system itself, like local market conditions, operator skill, and pure timing.
Reading Multi-Year Item 19 Data and Identifying Trends
When a franchisor publishes Item 19 data covering multiple fiscal years, the year-over-year comparison becomes one of the most powerful analytical tools available to prospective buyers. A single year of Item 19 data is a snapshot. Two or three consecutive years reveal a trajectory, and the trajectory matters more than any individual year's number.
What to Compare Across Years
Same-store revenue trends. If the franchisor tracks the same cohort of units across multiple periods, you can see whether existing units are growing, flat, or declining. Growing same-store revenue suggests the brand has momentum and operators are finding ways to increase throughput over time. Flat same-store revenue in a period of general economic growth may signal that the concept is reaching a ceiling in its existing markets. Declining same-store revenue is a clear warning that warrants direct questions to franchisees about what changed.
Average revenue movement vs. unit count movement. Rising average revenue in a growing system is the strongest signal. It means the franchisor is both adding units and the existing base is performing better. Rising average revenue in a shrinking system can be a mechanical effect, meaning the weaker units dropped out and the average rose as a result, not because anything actually improved. Declining average revenue in either a growing or shrinking system is a concern regardless of the explanation.
Changes in sample composition. Some franchisors change their Item 19 reporting methodology year over year. They may shift the maturity cutoff from 12 months to 24 months, add or remove affiliate-owned units, or redefine the revenue categories they report. When the methodology changes, direct year-over-year comparisons become unreliable. Check whether the footnotes explain any changes and ask the franchisor to provide comparable data under the prior methodology if possible.
Revenue mix shifts in multi-line businesses. For pet franchises that earn revenue from multiple streams, including memberships, day passes, beverage sales, events, and retail, shifts in the revenue mix year over year tell you how the business model is evolving. A shift toward recurring membership revenue and away from one-time transactions generally signals a more predictable and sustainable business. A shift in the other direction may mean the membership model is not retaining customers as well as the headline numbers suggest.
The revenue streams walkthrough for off-leash dog bars covers how multi-stream revenue models like Wagbar's work in practice and what drives each revenue line.
Sample Size and Time Frame
Two structural factors affect how meaningful any Item 19 average is, and both deserve careful attention before you put any weight on the headline number.
Why Sample Size Matters
A 47-unit sample produces more reliable averages than a 12-unit sample. As a rough heuristic, fewer than 20 units in the Item 19 sample means the average is heavily influenced by individual unit outcomes. With fewer than 10 units, the averages are arithmetic summaries of a handful of specific businesses rather than statistical patterns. Treat single-digit samples as informational only, not predictive.
With more than 50 units, the law of averages starts to apply, and the numbers become more predictive of what a new entrant might experience. At 100 or more units, the data becomes statistically meaningful enough to serve as a reasonable foundation for financial modeling, though local market adjustments still matter.
Why Time Frame Matters
"At least 24 months open" is the most common cutoff. Some franchisors use 12 months, which captures less mature units and usually lowers the average. Some use 36 months or longer, which excludes newer units and usually raises the average. Understanding the cutoff tells you whether the average represents mature, stabilized performance or includes units still in their ramp-up phase.
First-year units usually underperform mature units because ramp-up takes time. Units in their honeymoon period from months 3 to 18 can overperform if the franchisor recently launched with aggressive marketing spend. Mature units at three or more years give the most stable view of what steady-state performance looks like.
For a buyer planning a new opening, the relevant question is not what 36-month-old units earn. It is what your own location is likely to earn at 12 months, 24 months, and 36 months. Item 19 averages do not directly answer that question. Most buyers triangulate from Item 19 plus franchisee conversations plus their own local market analysis. The breaking-even timeline for dog bar franchise profitability covers what realistic ramp tends to look like in the first 24 months.
For pet-industry franchise buyers comparing systems, the combination of a larger sample and longer average operating history should increase confidence in the reported numbers. For context on the dog park and bar segment specifically as part of the broader pet industry, Wagbar's pet industry franchise context covers how this category fits within the larger sector.
What Is NOT in Item 19 and Why That Matters
Item 19 is more limited than buyers often assume. Even a well-written Item 19 leaves out information you need to make an informed decision. The rule constrains what franchisors can report, and what they choose to report is often the most flattering subset of what they could legally disclose. Knowing what is missing is as important as knowing what is there.
Owner compensation. A unit grossing $X with $Y in operating expenses might leave $Z for the owner, but if Item 19 only discloses gross revenue, the owner-take number is invisible. Net figures, when included, are usually labeled "before owner compensation," which means the owner's salary is being absorbed into the profit line. The practical question of "what will I actually take home" is almost never answered directly by Item 19.
Debt service. Loan payments on financing are operational realities for most franchisees but rarely show up in Item 19. A unit showing healthy net profit before debt service may still leave the owner with little after a $700,000 SBA loan payment. If you are financing a significant portion of your build-out, the gap between Item 19's "profit" and your actual cash flow after debt service can be substantial.
Local market variation. Item 19 is system-wide. Your specific market's demographics, competition, and real estate costs are not reflected. Two units with identical Item 19 averages can have very different economic outcomes depending on rent levels, labor costs, and the competitive landscape in their respective markets.
Failed or closed units. Most Item 19 disclosures exclude closed units. The dropout rate over time is in Item 20, not Item 19, and it is worth pulling forward into your analysis. A system with strong Item 19 averages and high Item 20 turnover tells a different story than one with strong averages and low turnover.
Personal owner factors. Owner-operator units typically out-earn semi-absentee units. If the Item 19 sample mixes both, the average obscures this distinction. A buyer planning to be semi-absentee should not plan around an average that includes hands-on operators putting in 60 hours a week.
Unit-level operating expenses. Many Item 19 disclosures report gross revenue but not costs. Without cost data, revenue tells you little about profitability. A $600,000 revenue unit with $550,000 in expenses produces a very different owner outcome than one with $400,000 in expenses.
Territory and demographic context. A $600,000 unit in a dense urban area with high disposable income is a different economic picture than a $600,000 unit in a small college town. Item 19 usually does not distinguish between these situations, which means the average blends fundamentally different operating environments.
The dog bar franchise cost breakdown covers how to layer ownership-model assumptions onto Item 19 averages.
Affiliate-Owned vs. Franchised Unit Data
Some franchisors include affiliate-owned unit data in Item 19 alongside franchised unit data. Some do not. Affiliate-owned units are typically run by the franchisor or its parent company. They often have advantages franchisees do not have, and those advantages can make the published averages misleading if you do not account for them.
Affiliate-owned units may pay no royalty, make no marketing-fund contribution, have direct access to the franchisor's management team, and sometimes operate in below-market lease arrangements in facilities the parent company owns. All of these factors improve unit-level economics in ways that are not available to a franchisee paying 6 percent royalty and 1 percent marketing fund contributions on top of market-rate rent.
Questions to ask when affiliate-owned data appears in Item 19 include the following. What percentage of the reported units are affiliate-owned versus franchised? Are the averages broken out separately or combined? Do the affiliate-owned units pay the same royalty and marketing-fund contributions that franchisees pay? How long have the affiliate-owned units operated compared to the franchised units?
Many candidates do not realize Item 19 averages often include affiliate data until they read the footnotes. Smart reading starts with the footnotes. Any asterisks or reference marks next to numbers deserve full attention. The footnotes explain the basis for every estimate and can reveal that the headline average includes corporate-owned locations operating under fundamentally different economics.
For a view of the concept driving demand in this category, the off-leash dog bar and park experience walks through the membership and day-pass model that generates the numbers any dog-bar Item 19 would report.
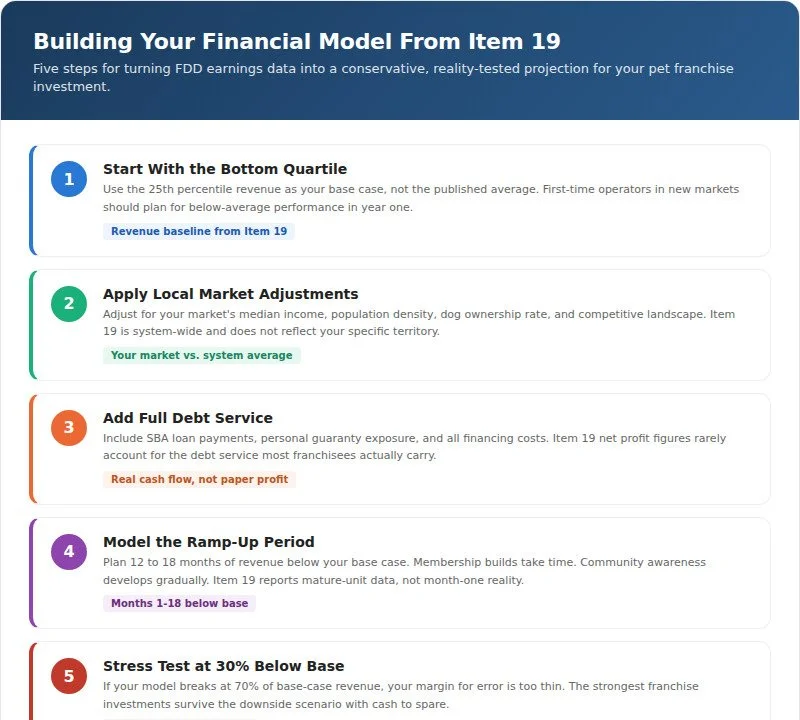
Building a Financial Projection From Item 19 and When Not To
Item 19 is not a projection. But a candidate can reasonably build a conservative financial model using Item 19 data as one input. The modeling question is how to use the numbers without treating them as promises. The difference between reading Item 19 well and reading it poorly is the difference between a financial model grounded in reality and one built on optimism.
A Defensible Approach to Item 19-Based Modeling
Step 1. Use the bottom quartile or the 25th percentile as your base-case revenue, not the average. A new operator hitting the top half of existing owner performance is an aspiration, not a plan. First-time franchisees operating in new markets should plan for below-average performance in year one and build toward the median over 18 to 24 months.
Step 2. Apply market-specific adjustments for income, population density, and local dog-ownership rates. A market with 45 percent dog ownership and $85,000 median household income presents a different opportunity than one with 30 percent dog ownership and $55,000 median income. Item 19 does not make these adjustments for you.
Step 3. Add full debt service, including personal guaranty exposure, to the expense side. If you are financing $600,000 of your build-out through an SBA loan, the monthly payment on that loan is a real expense that Item 19's net profit figures do not account for.
Step 4. Model a 12 to 18 month ramp-up period with revenue below base. New pet franchise locations rarely open at full capacity. Membership builds take time, community awareness develops gradually, and operational efficiency improves as the team gains experience.
Step 5. Test at base and downside, meaning 30 percent below base, to see whether debt still gets serviced. If your model breaks at 70 percent of base-case revenue, your margin for error is too thin. The strongest franchise investments survive the downside scenario with cash to spare.
Understanding Revenue Ramp in Pet Franchise Models
The ramp-up period deserves special attention because it represents the gap between what Item 19 shows for mature units and what a new location actually experiences. Most Item 19 disclosures report data from units that have been open for 24 months or more. A new location starting at zero members, zero brand recognition, and zero local reputation will not achieve those numbers on day one.
The typical ramp pattern for pet franchise concepts with a membership component follows a recognizable shape. Months 1 through 3 are about building initial awareness and enrolling founding members, often with promotional pricing. Months 4 through 9 see acceleration as word-of-mouth builds and the local community becomes aware of the location. Months 10 through 18 typically bring the unit to a sustainable operating level, though still below the system average for mature locations. Months 18 through 36 are when units approach and eventually reach the system averages reported in Item 19.
This means a buyer building a financial model from Item 19 data needs to project month-by-month revenue for the first 18 to 24 months at levels significantly below the Item 19 average, then transition to mature run-rate assumptions. Using the Item 19 average from month one would dramatically overstate early cash flow and understate the amount of working capital needed to bridge the ramp period.
The breaking-even timeline for dog bar franchise profitability provides specific ramp benchmarks and the pet franchise investment guide covers the capital planning that supports a realistic ramp scenario.
What to Avoid
Using top-quartile numbers as the planning base, ignoring ramp-up time, assuming your territory will match system-wide averages, and treating any specific Item 19 number as a guaranteed outcome are the four most common financial planning errors franchise buyers make. Each one introduces optimism bias into a model that should be built conservatively.
A franchise attorney or financial advisor can help structure the modeling. For a sense of what the legal and financial vetting process looks like from the franchisee side, the Richmond franchisee announcement covers AJ Sanborn's transition from a financial-services career into pet-industry franchise ownership.
Cross-Checking Item 19 With Item 20 Conversations
The most reliable way to read Item 19 is to validate it against direct conversations with franchisees from Item 20. Item 19 and Item 20 are designed to be read together. Item 19 shows what units earn. Item 20 shows how many units opened, closed, transferred, or were terminated. Strong numbers in Item 19 lose meaning if Item 20 shows that half the system turned over last year.
Cross-Checks Worth Running
Revenue trend vs. unit count trend. If Item 19 shows rising average revenue but Item 20 shows declining unit count, the rising average may come from closing weak units rather than improving operations. This is a mechanical effect. Remove the bottom performers and the average goes up, even if nothing actually improved.
Transfer rate vs. reported earnings. High transfer rates in Item 20 paired with strong Item 19 numbers can signal that owners are selling out of otherwise-profitable units. Ask why. Transfers can reflect lifestyle choices, but a pattern of them may indicate that the day-to-day reality of operating the business is harder than the numbers suggest.
Termination rate vs. reported earnings. Terminations in Item 20 that were not voluntary, meaning "terminated by franchisor," paired with strong Item 19 numbers are a red flag about franchisor behavior. If the franchisor is removing franchisees from the system, the reasons matter.
Multi-year comparison. If Item 19 tracks the same metric across multiple years, Item 20's unit count pattern over the same years should match the story. A clean FDD tells a consistent story. Item 19 saying "units are performing well" and Item 20 saying "units are closing" is a contradiction worth asking about.
Questions to Ask Franchisees About the Numbers
Item 19 is paper. Franchisees are primary sources. When you call current owners from Item 20, Item 19 should anchor part of the conversation. A well-designed call can verify whether the numbers in the FDD match the numbers owners see every day.
Does the Item 19 average match what you actually saw in your first 12 and 24 months?
What is the variance between top and bottom-performing units in the system?
What drives the variance?
Where did your unit fall relative to the published average?
What did the franchisor not disclose in Item 19 that materially affects your real economics?
If you could publish your own Item 19 representation for your unit alone, what would it say versus what the franchisor publishes for the system?
How close did your actual first-year revenue come to the Item 19 numbers?
How did your revenue mix compare to what the FDD shows?
What expense categories ran higher than you expected?
Would you say the Item 19 numbers gave you a fair picture before you signed?
Franchisees who have operated for 24 or more months are the best source for these answers. Item 20 of the FDD lists current and former franchisees with contact information. If several franchisees answer consistently, you have verification. If answers vary, or if some owners hint at caution, that is worth pursuing with more calls. The 10 questions to ask current franchisees page covers the broader list of questions worth working into the conversation.
How Item 19 Connects to the Rest of the FDD
Item 19 does not exist in isolation. It connects to several other FDD items, and reading it without those connections produces an incomplete picture. Understanding where Item 19 fits in the larger document helps you use the data more effectively and spot inconsistencies that warrant further investigation.
Item 7 and initial investment. Item 7 lists the estimated total investment to open a franchise unit. Item 19 shows what operating units earn. Together, they form the basic ROI equation that every buyer needs to evaluate. An Item 19 average of $600,000 in revenue means one thing for a buyer investing $500,000 total and something entirely different for a buyer investing $1,100,000. The ratio of Item 19 revenue to Item 7 investment is a starting point for calculating your return on invested capital, though it requires significant additional work around operating expenses, debt service, and ramp-up timing. The Item 7 initial investment walkthrough covers how to read that section in detail.
Item 20 and franchisee contact list. As covered extensively above, Item 20 is the validation layer for Item 19. The contact information for current and former franchisees lets you verify whether the published numbers match real-world operator experience. Item 20 also reports the system's unit-count changes over three years, which provides context for whether Item 19 averages reflect a healthy growing system or a contracting one.
Item 21 and franchisor financial health. While this guide focuses on Item 19, a brief note on Item 21 is important for context. Item 21 contains the franchisor's own audited financial statements and reveals whether the company behind the brand is financially stable. Strong Item 19 unit-level data loses some of its value if the franchisor's own financials show instability, because a financially distressed franchisor may not be able to deliver the support, training, and brand development you are counting on. Read Item 21 as a threshold check before putting heavy weight on Item 19 numbers. The FDD Item 21 financial statements walkthrough covers that section in depth.
Item 3 and litigation history. Past lawsuits by franchisees alleging misrepresentation in the earnings disclosure process can indicate problems with how Item 19 data has been communicated or used in the past. If Item 3 shows a pattern of franchisees suing over earnings representations, that pattern should inform how much confidence you place in the current Item 19 data.
Items 5 and 6 and ongoing fees. The initial franchise fee (Item 5) and ongoing fees (Item 6) directly affect the gap between Item 19's gross revenue figures and what you actually keep. A system with 6 percent royalty and 1 percent marketing fund contributions takes 7 percent off the top of adjusted gross sales before any operating expenses are paid. Understanding the fee structure is essential for converting Item 19 revenue data into a meaningful profitability estimate.
Working With a Franchise Attorney
The FDD review period is 14 calendar days from the date you receive the document. During that window, you cannot sign anything or pay any fee. The intent is to give you time to review the document with qualified advisors before making a binding commitment. This 14-day window is a federal protection, and no franchisor can legally pressure you to waive it or rush through it.
Engaging a franchise attorney who works specifically with franchise transactions is strongly recommended. General business attorneys are often unfamiliar with franchise law nuances, the significance of specific FDD items, or the implications of particular contract clauses that can affect your rights for the duration of the franchise agreement. A franchise-specialist attorney will review the agreement alongside the FDD, flag unusual or unfavorable terms, and help you understand your rights and obligations before you commit.
The difference between a general business attorney and a franchise-specialist attorney is significant in this context. Franchise law has its own body of precedent, its own regulatory framework at both federal and state levels, and its own set of common pitfalls that a generalist may not recognize. Issues like post-termination non-compete clauses, personal guarantee language, transfer restrictions, and territory encroachment provisions have franchise-specific implications that require franchise-specific knowledge to evaluate properly.
The cost of a franchise attorney review, typically $1,500 to $3,000 for a straightforward transaction, is a small fraction of the total investment and a sensible use of resources given the stakes involved. For a pet franchise in Wagbar's investment range of $470,300 to $1,145,900, skipping attorney review to save $2,000 is a poor trade-off by any measure. The franchise agreement governs a relationship that typically lasts 10 to 20 years, and the terms you agree to today will affect your operations, your exit options, and your financial outcomes for the entire duration of that relationship.
The pet business legal guide covers additional legal considerations relevant to pet franchise operation beyond the FDD review process. The guide to finding and hiring a franchise attorney walks through the process of selecting and working with qualified franchise counsel.
Red Flags to Watch for in Any FDD
Not every FDD presents a clean picture, and knowing what signals to pay attention to during review is as important as knowing what to look for when things look good. These red flags apply across the entire document, not just Item 19.
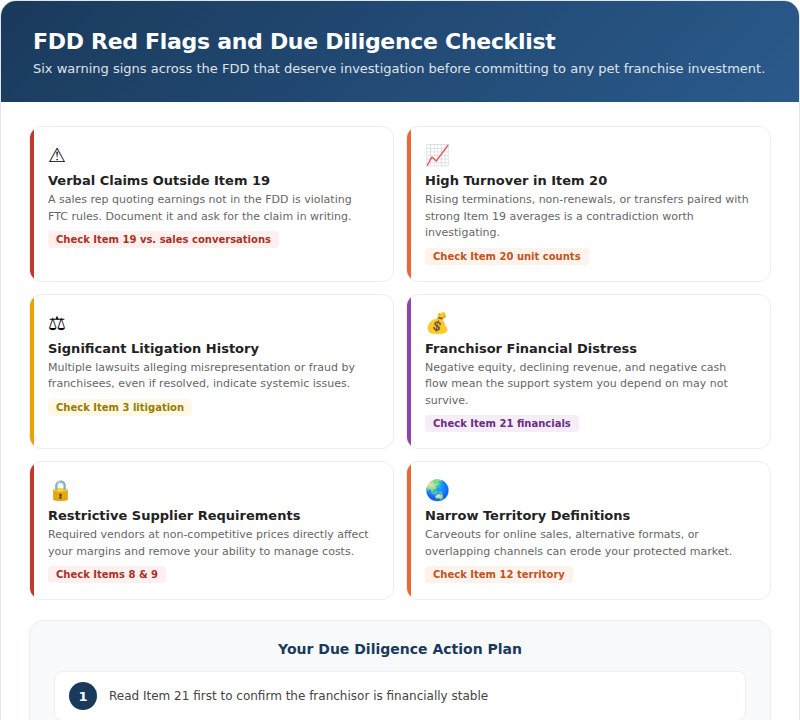
High franchisee termination or non-renewal rates in Item 20. Occasional terminations are normal in any franchise system. A pattern of them may indicate a struggling system, unrealistic expectations set during the sales process, or ongoing franchisor-franchisee conflict. If the termination count is rising year over year, that trend matters more than any individual case.
Significant litigation history in Item 3. Past lawsuits involving franchisees alleging misrepresentation or fraud should be scrutinized even if they were resolved in the franchisor's favor. The nature, frequency, and outcomes of litigation tell you about the franchise relationship and how disputes are handled.
Verbal earnings claims that do not match Item 19. The FTC franchise rule prohibits earnings claims outside the Item 19 disclosure. If a development representative tells you "most franchisees earn $X" and that figure is not in Item 19, the representative is likely violating the rule. Document the conversation and ask for the claim in writing. This is a significant compliance issue that reflects on the franchisor's internal controls and sales culture.
Restrictions on suppliers or required purchases in Items 8 and 9. These restrictions affect your operating costs directly. If you are required to purchase supplies or equipment from designated vendors at prices you cannot control, that affects your margins and your ability to manage costs independently. Ask whether franchisees have found the required-vendor pricing to be competitive with market alternatives.
Unusual or heavily restrictive territory definitions in Item 12. Your protected territory affects your ability to grow and your protection against cannibalization by other system locations. If your protected territory is defined narrowly or contains carveouts that allow the franchisor to compete near your location through other channels, that is a negotiating point worth raising before signing. Territory definitions that seem generous at first reading sometimes contain exceptions for online sales, catering, wholesale, or alternative-format locations that effectively allow the franchisor to compete within your geographic area through different channels.
Inconsistencies between Item 19 data and Item 20 unit counts. If Item 19 reports strong unit-level performance but Item 20 shows a pattern of closures, transfers, and terminations over the same period, the two sections are telling different stories. One of them is incomplete, and your job during due diligence is to figure out which one and why.
Financial distress visible in Item 21. While this guide focuses on Item 19, a franchisor showing declining revenue, mounting losses, and negative cash flow in its own financial statements in Item 21 is a company under pressure. That pressure can lead to cutting franchisee support, increasing fees, or making operational changes that affect your business. Check Item 21 as a stability threshold before committing.
What Item 19 Tells You About Seasonality and Revenue Patterns
One dimension of Item 19 that many prospective franchisees overlook is what the data reveals about seasonal revenue patterns. Most Item 19 disclosures report annual figures, which smooth out the peaks and valleys that define what month-to-month cash flow actually looks like. Understanding the seasonality hidden inside those annual numbers is critical for cash flow planning and working capital management.
Pet franchise concepts with outdoor components, like off-leash dog parks, show meaningful seasonal variation depending on geography. A location in the Southeast may see strong year-round traffic with a slight summer dip during extreme heat. A location in the Northeast or Midwest may see significant winter softness when outdoor usage drops.
When reading Item 19, ask whether the data breaks out revenue by quarter or month. If it does not, ask franchisees from Item 20 about their seasonal patterns. Specifically, ask what their weakest revenue month looks like relative to their strongest. If the strongest month is 2x the weakest, your cash reserves need to carry the business through the lean period without dipping into emergency funds.
Seasonality also affects ramp-up planning. A location that opens in September in a market with strong fall and spring seasons will have a different first-year trajectory than one that opens in June and immediately hits the summer slowdown. The timing of your opening relative to local seasonal patterns can accelerate or delay your path to the revenue levels Item 19 reports for mature units.
The research on dog-franchise-friendly markets covers the demographic and climate factors that affect unit-level economics and seasonal patterns.
Wagbar's Approach to Item 19
Wagbar's FDD follows the structure required by the FTC franchise rule, including the 23 standardized items. Whether and how Item 19 is presented in any specific FDD edition is a question the Wagbar franchise development team answers directly when prospective buyers reach the FDD review stage.
What Wagbar can speak to consistently is the underlying economics that any Item 19 representation would reflect. The franchise economics include a $50,000 franchise fee, 6 percent royalty on adjusted gross sales, 1 percent marketing fund contribution, and a 50 percent franchise fee discount for buyers committing to three or more locations. Estimated total initial investment runs $470,300 to $1,145,900, an estimate required by the FTC franchise rule that is not a guarantee of profitability or earnings.
Existing franchisees, including AJ Sanborn in Richmond, Dianna in Phoenix, Jennifer in Los Angeles, Liz and Shelby in Knoxville, Brandi and Denise in Charlotte, and Matt and Taylor in Myrtle Beach, are the right source for specific questions about real-world unit performance, and their backgrounds are covered in the Wagbar franchise owner profiles.
For candidates considering Wagbar's pet franchise opportunity, the right sequence is to request the current FDD, read Item 19 alongside Items 20 and 21, identify the specific questions the numbers raise for your market, and bring those questions to 5 to 10 current franchisee calls. By the time that loop closes, you have a picture of realistic unit economics that is grounded in both paper disclosure and live operator experience.
Frequently Asked Questions About Item 19 Earnings Claims

Is Item 19 required to be in every Franchise Disclosure Document?
No. Item 19 is the only optional item in the FDD. Roughly 60 to 70 percent of franchisors include one. If a franchisor does not include Item 19, no representative may make any earnings claim verbally or in marketing materials, and your only source of unit performance information becomes Item 20 franchisee conversations.
Can I trust the numbers in Item 19?
Item 19 representations must have a reasonable basis and must be substantiated on request. Most franchisors are honest in their Item 19 disclosures because the legal liability for misleading representations is significant. The harder question is not whether the numbers are honest but whether they predict your specific future. They usually do not, directly. Validating with Item 20 conversations and your local market analysis matters more than trusting the headline number.
What if the franchisor's verbal claims do not match Item 19?
This is a flag worth raising. The FTC franchise rule prohibits earnings claims outside the Item 19 disclosure. If a development representative tells you "most franchisees earn $X" and that figure is not in Item 19, the representative is likely violating the rule. Document the conversation and ask for the claim in writing.
What is a healthy Item 19 sample size for a pet franchise?
20 or more units in the sample produces reasonably reliable averages. 50 or more starts to look statistically meaningful. Fewer than 10 means the average is essentially anecdotal. For a young pet franchise, expect smaller sample sizes. That is not necessarily a problem, but it does shift more weight onto franchisee conversations.
Should I project my own revenue using the Item 19 average?
Cautiously. Most buyers project low end, mid range, and high end scenarios using Item 19 quartiles or percentile breakdowns when available, plus their own assumptions about local market factors. Projecting a single number based on the system average usually leads to financial planning errors when actual ramp is slower than the average suggests.
How does Item 19 relate to Item 7?
Item 7 shows the estimated investment to open. Item 19 shows operating performance once open. A complete financial picture pulls from both. A buyer reading only Item 19 may be impressed by unit performance while underestimating the capital needed to open in Item 7. The ratio of Item 19 revenue to Item 7 investment is a starting point for calculating potential return on invested capital.
What if Item 19 looks great but franchisees tell me a different story?
Trust the franchisees. Item 19 averages are what they are, but franchisee on-the-ground perspective on unit economics, owner workload, and franchisor support is more predictive of your future experience. If franchisee conversations contradict Item 19, ask both sides about the discrepancy and watch how each responds.
What does "financial performance representation" mean?
"Financial performance representation" or FPR is the formal term for an Item 19 disclosure. The FTC Rule uses the term to distinguish factual historical data from prohibited forward-looking projections or guarantees.
Is Item 19 the same thing as an earnings claim?
Yes, in modern FDD terminology. "Earnings claim" was the older term used before the 2008 amendments. "Financial performance representation" is the current legal label, though both terms appear in practice and refer to the same section.
What if Item 19 only shows revenue, not net income?
That is common and legally allowed. Revenue data alone does not tell you what operators actually earn after expenses. Use franchisee calls to fill in the cost picture. Ask about food cost, labor cost as a percentage of revenue, rent as a percentage of revenue, and utilities.
Can the franchisor give me more detailed Item 19 data verbally?
No. Under the FTC Rule, any earnings claim has to be in writing in the FDD. Verbal claims outside the FDD are prohibited. If a salesperson starts quoting numbers not in Item 19, that is a compliance issue worth flagging.
How often does Item 19 get updated?
Annually, at minimum. Franchisors must file updated FDDs yearly in registration states and whenever material changes occur. The Item 19 data reflects the most recent complete fiscal year.
What is the difference between a financial representation and a financial projection?
A financial performance representation, which belongs in Item 19, is based on actual historical data from operating locations. A projection is an estimate of future performance. Franchisors are not permitted to include forward-looking projections in Item 19. Everything disclosed must have a documented historical basis.
How do I get the FDD for a franchise I am evaluating?
Federal law requires the franchisor to provide you with the FDD at least 14 days before you sign any agreement or pay any fee. You can request it earlier in the evaluation process. Many franchisors provide the FDD after an initial qualification call or application. To request Wagbar's FDD, connect with the franchising team through the franchising page.
Can a franchisor be sued for misleading Item 19 data?
Yes. Item 19 is a statement of fact, and a franchisor who publishes materially inaccurate performance data can face federal and state claims. This is why FDD filings go through attorney review and, in registration states like California, substantive state agency review before publication.
Why do some franchisors publish nothing in Item 19?
Multiple reasons apply. The system may be too young to report meaningful data, the sample size may be too small, legal counsel may have advised against publication, or the current numbers may not be flattering enough to help recruitment. Ask the franchisor directly which applies and evaluate the answer against what you learn from franchisee conversations.
Can I negotiate terms in the franchise agreement after reviewing the FDD?
The FDD contains the form franchise agreement as an exhibit. Some franchisors negotiate limited terms while others do not. Common negotiating points include territory size and definition, personal guarantee scope, renewal terms, and transfer fees. A franchise attorney will help you identify which terms are worth raising and how to approach those conversations.
What Every Prospective Franchisee Should Remember About Item 19
Item 19 earnings claims in pet franchise FDDs are useful for setting expectations but limited as a forecasting tool. Averages obscure unit-level variation, sample size matters more than headline figures, and the absence of an Item 19 is itself information worth evaluating. The strongest due diligence process uses Item 19 as context rather than conclusion, layering it with franchisee conversations from Item 20, a stability check on the franchisor through Item 21, an independent market analysis for your specific territory, and a review by a qualified franchise attorney who can spot the issues you might miss.
For a complete overview of how the FDD is structured and what each section covers, Wagbar's complete guide to what a franchise is walks through the process from evaluation through agreement. The off-leash dog bar investment checklist covers ten categories worth vetting before signing. The benefits of owning a pet franchise page and the dog business models complete guide provide additional context on what the Wagbar system offers franchisees beyond the financial disclosures. The Wagbar FAQ page covers common prospective-franchisee questions and the early-stage research steps most serious candidates take.
When you are ready to request the FDD and begin the formal evaluation process, the Wagbar franchising page is where that conversation starts. Contact franchising@wagbar.com to begin the FDD request process.
Bottom TLDR: Item 19 earnings claims are the section of the FDD that carry the most financial weight for pet franchise buyers evaluating unit-level performance. Read Item 19 for the sample size, time frame, and distribution rather than the headline average. Cross-check the data against franchisee conversations from Item 20, verify franchisor stability in Item 21, and layer in your own market research before committing to any pet franchise investment.

FDD disclaimer: This information is not intended as an offer to sell, or the solicitation of an offer to buy, a franchise. It is for information purposes only. An offer is made only by Franchise Disclosure Document (FDD). Currently, the following states regulate the offer and sale of franchises: California, Hawaii, Illinois, Indiana, Maryland, Michigan, Minnesota, New York, North Dakota, Oregon, Rhode Island, South Dakota, Virginia, Washington, and Wisconsin. If you are a resident of, or wish to acquire a franchise for a Wagbar to be located in one of these states or a country whose laws regulate the offer and sale of franchises, we will not offer you a franchise unless and until we have complied with applicable pre-sale registration and disclosure requirements in your jurisdiction. Wagbar Franchising LLC, (828) 554-1021, 7 Kent Place, Asheville, NC 28804.